Introduction
Spring boot actuators are essential tools for managing and monitoring the spring boot application program in production. Actuator provides auditing, health, CPU usage, HTTP hits, mapping, database, etc. In this blog, we will learn how to use an actuator with a spring boot application.
Prerequisites
- JDK 11 or Later
- Maven or Gradle
- Spring Boot Development Environment (Here we use IntelliJ IDEA)
What is an Actuator?
The actuator is mostly used to expose operational information about the running application. It provides production-ready features that help to manage and monitor spring boot applications using HTTP or JMX.
Actuator includes auditing, health, CPU usage, HTTP hits, metrics, etc.
Why use an Actuator?
The actuator is used to simply manage and monitor by :
- Providing built-in health to check our application
- Exposing metrics for performing application
- Auditing the application
How to use an Actuator effectively with a spring boot application
Step 1 : Implementing the spring boot application
- First of all, we need a project setup so please go to Spring Initializer and set up the project as per our requirements.
- Open IntelliJ IDEA and set up the project.
- Add one helper package and in the package add on Student class and create a constructor.
					package com.example.acturator.helper;

import org.springframework.stereotype.Component;

@Component
public class Student {

  public Student() {
    System.out.println("Creating a object for student");
  }
}
- Then, add one controller in the application and the controller creates one method.
					package com.example.acturator.controller;

import com.example.acturator.helper.Student;
import org.springframework.web.bind.annotation.GetMapping;
import org.springframework.web.bind.annotation.RestController;

import java.util.Map;

@RestController
public class HomeController {

  private final Student student;

  public HomeController(Student student) {
    this.student = student;
  }

  @GetMapping
  public String hello(){
    return "Hello World";
  }

  @GetMapping("/data")
  @Timed(value = "controller.executeTime", description = "Time taken to process the Doc Ref API")
  public Map<String,String> getStudentData(){
    return Map.of("Name","Dhruvi");
  }
}
- Then start to run the application and hit the following API in the browser.
- http://localhost:8080/data
- Showing the following output in the browser :
					{
    "Name": "Dhruvi"
}
Step 2 : Adding dependency for Actuator in pom.xml
- When we Add the following dependency for the Maven project in our application and then Re-run the application:
					<dependency>
   <groupId>org.springframework.boot</groupId>
   <artifactId>spring-boot-starter-actuator</artifactId>
</dependency>
- Show the following O/P after adding actuator dependency :

- In this o/p we will see that Exposing 1 endpoint.
- Hit the following URL in the browser
- http://localhost:8080/actuator
- O/P :
					// 20241224112450
// http://localhost:8080/actuator

{
  "_links": {
    "self": {
      "href": "http://localhost:8080/actuator",
      "templated": false
    },
    "health-path": {
      "href": "http://localhost:8080/actuator/health/{*path}",
      "templated": true
    },
    "health": {
      "href": "http://localhost:8080/actuator/health",
      "templated": false
    }
  }
}
- When click the /health then show the status is up.
					// 20241224121551
// http://localhost:8080/actuator/health

{
  "status": "UP
}
Step 3 : Configuring Actuator EndPoints
There are more configurations for the actuator, some are listed below :
We can also change the default endpoint /admin instead of /actuator by adding the following in the application.properties file.
management.endpoints.web.base-path=/admin
2. Use Include endpoint which Actuator endpoints should be explicitly enabled.
- To show all the exposed endpoints via HTTP.
management.endpoints.web.exposure.include=*
- To show all the expose only the health and info endpoints via HTTP.
management.endpoints.web.exposure.include: health,info
3. Use Exclude which Actuator endpoints should be explicitly disabled.
- This will disable the shutdown endpoint, even if all other endpoints are exposed.
management.endpoints.web.exposure.exclude: shutdown
4. Other use cases of the Actuator include determining how long each API takes to execute
management.endpoints.web.exposure.include=*
management.metrics.enabled=true
management.observations.annotations.enabled=true
- This enables the metrics feature in Spring Boot Actuator, allowing the application to collect and expose data like JVM memory usage, CPU usage, and API request counts.
- This enables the use of the @Observed annotation for tracking custom metrics and performance observations.
- Following steps to follow to run the application :
- Hit this URL in the postman: http://localhost:8080/actuator
- When hit the below URL then go to /metrics
- And then hit API in the postman: http://localhost:8080/data
- And then again hit the URL: http://localhost:8080/actuator/metrics
- Show the our custom endpoint:

- When hit the URL: http://localhost:8080/actuator/metrics/controller.executeTime
- To show the Total number of times the API was executed the total time spent executing the API across all calls, and the Maximum execution time for a single request.

Step 4 : How to Create Custom EndPoints
We can also create custom endpoints in the actuator in the spring boot application, let’s see how to create it.
- To create an actuator package and inside the package create one custom endpoint class.
					package com.example.acturator.actuator;

import org.springframework.boot.actuate.endpoint.annotation.DeleteOperation;
import org.springframework.boot.actuate.endpoint.annotation.Endpoint;
import org.springframework.boot.actuate.endpoint.annotation.ReadOperation;
import org.springframework.boot.actuate.endpoint.annotation.WriteOperation;
import org.springframework.stereotype.Component;

@Component
@Endpoint(id = "customEndpoint")
public class CustomEndpoints {

    @ReadOperation
    public String hello(){
      return "Hello World this is a custom endpoint!!";
    }

  @WriteOperation
  public String writeOperation(String name) {
    return "Hello, " + name;
  }

  @DeleteOperation
  public String deleteOperation() {
    return "Delete operation performed";
  }
}
- @EndPoint: It is a marked class as a custom endpoint.
- @ReadOperation: It handles the HTTP Get requests.
- @WriteOperation: It handles the HTTP Post requests.
- @DeleteOperation: It handles the HTTP Delete requests.
- Then run the application hit the in the postman hit the following URLs and show the o/p.
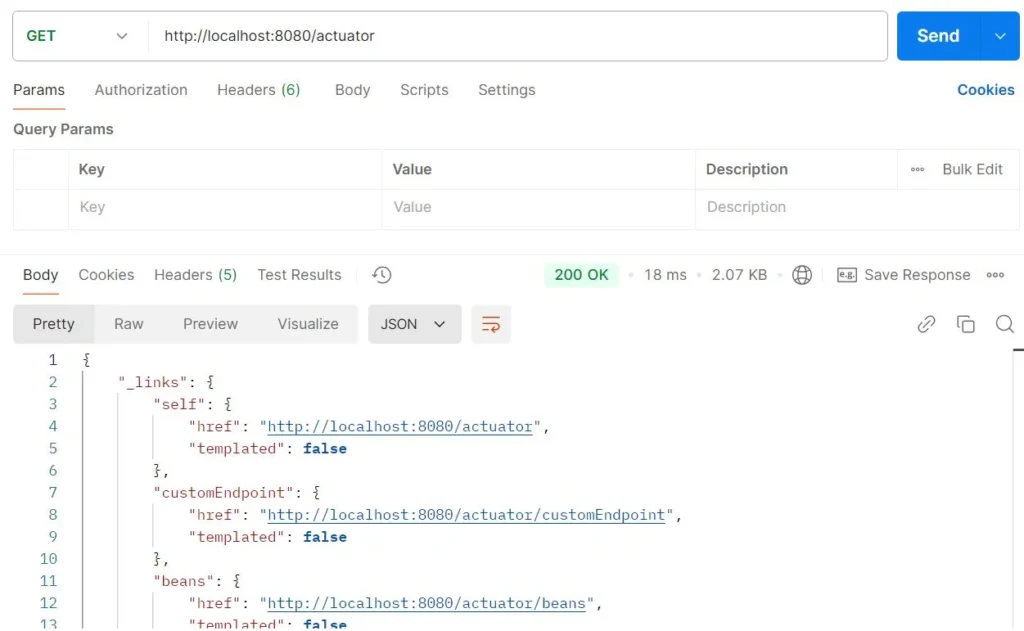
- Using get data: @ReadOperation annotation is used to read all the data from the application.

2. Using add data: @WriteOperation annotation is used to add data in the application.

3. Using delete data: @DeleteOperation annotation is used to delete data from the application.

Step 5: Other Actuator EndPoints
Endpoints | Description |
Health | To check the health of the application. |
Info | Display the arbitrary application information. |
Metrics | To check the application’s metrics, such as Memory and CPU usage. |
Env | Display the environment properties such as system properties and configuration properties. |
Beans | Display the list of all beans in the application. |
Loggers | Display and allow modification of logging levels for different packages and classes. |
Mappings | Display all HTTP request mapping in the application. |
Threaddump | Provide the thread dump of the application. |
Httptrace | Displays HTTP request and response trace information. |
Scheduledtasks | Display the list of all scheduled tasks in the application. |
Heapdump | Provides a heap dump of the application’s JVM. |
Shutdown | Allows gracefully shut down the application. |
Conclusion
In this blog, we showed how to make an effective spring boot application using an actuator. To manage and monitor the application we used Actuator. and we can also check the health of the application, audit the application, and display some other actuator endpoints used in the spring boot application program. You can also add how to secure endpoints and how to create custom objects.

