Centralized Logging System for Liferay

Introduction
For large-scale applications, it becomes difficult to track each of the component’s health and logs. In such cases, a centralized logging system comes into the picture. A centralized logging system could be a great help in collecting all the logs so that users can have data on the whole system. This data could help users perform large-scale monitoring and ensure system security from one place.
The general idea behind implementing centralized logging systems is that we need some mechanism to pull data from different systems and collect it in one place. As elastic search is supported in Liferay, it is a wise choice to use it for tracking logs.
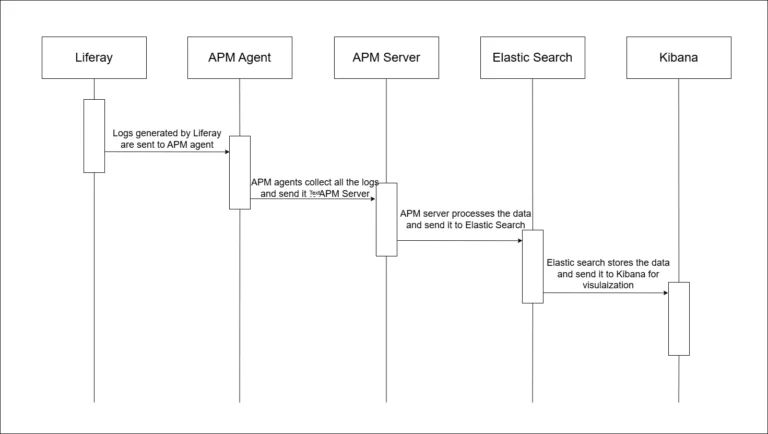
Centralized Logging System for Liferay using APM agent
Elastic Search
Elasticsearch is an open-source distributed, RESTful search and analytics engine, that is designed for handling large-scale data and also to grow according to the organization’s growth. It is also called the heart of the Elastic Stack, as it can store data for lightning-fast search, fine‑tuned relevancy, and powerful analytics that scale with ease. Elasticsearch is frequently utilized for use cases involving log analytics, full-text search, security intelligence, business analytics, and operational intelligence.
It can be used for manipulating and analyzing structured and non-structured data in almost real-time. Using elastic search clusters, data could be fetched from different sources in a very small amount of time.
Kibana
An open-source tool for data analysis and visualization is called Kibana. This is a useful tool for displaying elastic search data in an elastic stack. With the data that Elastic provides, users can use this impromptu tool to build a variety of maps, graphs, and charts. This feature aids in deciphering intricate datasets and gleaning insightful information.
In summary, Kibana sits on top of elastic search, which is used for data processing and storage, to view the activity occurring on elastic search.
APM Agent
An APM agent is software installed alongside applications to collect performance metrics, trace transactions, and monitor application health in real-time. These agents are tailored to work seamlessly with Elastic’s APM offerings, like Elastic APM within the Elastic Stack, offering in-depth analysis of application performance, dependencies, and potential issues
APM Server
The Application Performance Monitoring Server, i.e., the APM Server, is an integral part of the Elastic Stack. It is built to receive and handle performance data from APM agents installed within applications. Its main function is to gather, organize, and store metrics, traces, and errors produced by these agents. Serving as a connector, the APM Server links APM agents with other Elastic Stack elements like Elasticsearch and Kibana.
Advantages
- Improved Data Visibility and Monitoring : All the logs throughout the systems(almost in real-time) can be managed in one place to make them more visible and hence improve server monitoring.
- Easier to Troubleshoot and Debug : As the logs are maintained in one place, it makes it easier to identify the root cause of the error.
- Enhanced Security : The permissions to view all the logs are maintained in one place. If there is some trespassing, it is easier to notice in a centralized location.
- Scalability : As the organization grows, the data volume can be easily managed with the help of a centralized logging system. The advanced indexing and search capabilities can help the system maintain its performance.
- Cost Efficiency : Using one system eliminates the need to use multiple logging tools hence reducing management costs.
- Easy Filtering : Similar data can be filtered using elastic queries for analysis.
- Enhanced Error Tracking : Elastic APM collects all the unhandled errors and exceptions. All the errors are grouped based on the stack trace making it easier to identify new errors by keeping an eye on them.
- Easier to set up : APM agents can be set up easily for monitoring applications just by using a few lines of code.
- Code level diagnostics : APM agents can exactly show where errors are occurring in the codebase, how long an operation is taking, and where the application is slowing down.
Conclusion
A general idea regarding the use of a centralized logging system for Liferay is presented.